

What Is the Sieve Analysis Test and How Does It Determine Gradation?
Published on:
October 20, 2026
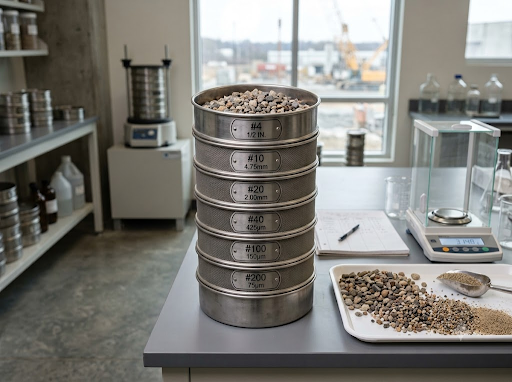
The sieve analysis test is a lab method where a dry aggregate sample is shaken through a stack of screens, each with smaller openings than the one above. The material left on each screen is weighed, and those weights show how much of the sample falls into each size range. That breakdown is the gradation.
At Western Materials, we depend on this test to make sure our products match what your project calls for. The right gradation matters when selecting sand and gravel in Los Angeles, as particle sizes can affect how materials perform in different applications. In this blog, we will explain how the sieve analysis test works, how to read the results, and why it is worth checking before you buy.
Why Gradation Needs Testing at All
Stand next to two piles of gravel, and they can look almost the same. Yet one may compact beautifully while the other drains poorly or leaves your concrete mix harsh and hard to finish. The difference is usually gradation, which is simply the mix of particle sizes in the material. The aggregate gradation of sand and gravel affects compaction by influencing how tightly the particles fit together.
Your eyes cannot judge that reliably. A proper aggregate gradation test gives you numbers instead of guesses, and numbers are what engineers, inspectors, and contractors can all agree on. This also helps engineers and contractors distinguish between density, gradation, and compaction in aggregate.
What the Test Needs
No elaborate equipment is required here. All you need is a stack of sieves, a shaker, a weighing balance, an oven, and some brushes to clean the sieves. The sieves are placed one above the other, starting from the largest aperture to a pan at the bottom.
Most labs follow ASTM C136 or AASHTO T27. Both describe how big the sample should be, how to dry it, and how long to shake it. Larger stones need a larger sample, because a handful of big rocks would not represent a whole stockpile.
Need the right & lab-tested aggregate for your project?
Contact Western Materials Now
How the Test Runs
First, the sample is dried in an oven until its weight stops changing. This step matters more than people think. Damp fine particles cling together and behave like larger ones, which throws the whole result off.
Once dry, the sample is weighed and poured onto the top sieve. The stack goes into the shaker for about ten minutes, long enough that almost nothing more is passing through. Then each sieve is emptied onto the balance, and the weight of the material it holds is recorded.
Finally, the lab adds up all those weights and compares the total with the starting weight. The two should match very closely. If they do not, something went wrong, such as lost material or a sieve that was overloaded, and the test is repeated.
Understanding Sieve Aperture Size
The sieve aperture refers to the gap between wires forming the sieve. If a particle is greater than the aperture, then it will not pass through; otherwise, it passes through the sieve.
For coarse aggregate sieve analysis, we use sieves like 3/4 inch and 3/8 inch. For sands, we have numbered sieves, whereby No. 4 has a sieve aperture of 4.75 mm, while No. 200 has an aperture of only 0.075 mm. The higher the number, the smaller the aperture of the sieve.
Since each sieve has a particular sieve aperture, each weight obtained using a balance has particular significance. For example, material left in the No. 30 sieve has a grain size greater than 0.6 mm but smaller than the aperture of the next sieve. This is how loose sand becomes useful information.
Turning Weights into a Particle Size Distribution (PSD)
This is where gradation is truly achieved. For each sieve, the lab calculates the percent retained by dividing the weight retained by the total weight of the sample, multiplied by 100. This yields the percent retained value. Adding all the percent retained values starting from the top sieve yields the cumulative percent retained. Subtracting the cumulative percent retained value from 100 yields the percent passing value.
For example, the process starts with 1,000 grams. The weight retained by the 3/8-inch sieve being 100 grams means 10 percent retained and 90 percent passing. The weight retained by the next sieve, being 200 grams, makes the cumulative percent retained 300 grams, meaning 30 percent retained and 70 percent passing. This goes on until all the sieves are accounted for.
Percent passing versus sieve size yields the gradation curve. The gradation curve is the graphical representation of the particle size distribution (PSD), and it is the easiest part to understand.
Reading the Curve
A curve that slopes gently through a range of sizes is an indication of a well-graded soil, characterized by a good proportion of coarse, medium, and fine-sized aggregates, which compact well and form a dense and stable structure.
A steep curve close to the vertical line is indicative of a uniform soil. Such soils have similar particle sizes and can support effective drainage, although they may compact poorly. Their interconnected spaces also affect water movement, making void structure in aggregate drainage an important consideration. Their interconnected spaces also affect water movement, making void structure in aggregate drainage an important consideration. A curve with a flat zone in the middle indicates a gap-graded soil lacking intermediate particle sizes.
The laboratory also analyzes the curve with the specifications. The curve should lie within the specified range in order to pass. It further determines the fineness modulus of sand, a measurement that indicates its overall coarseness or fineness and highlights the importance of fineness modulus in construction sand.
Unsure which aggregate mix fits your compaction or drainage needs?
Get Project-Specific Aggregate Advice
Mistakes That Skew the Results
Even a basic test can fail. Some of the typical errors include overfilling the sieve, which will prevent the particles from falling through the holes; not drying the materials, or shaking for too little time. Problems such as mesh being damaged or clogged will alter the data unnoticed.
The most serious error is sampling. When the sample is collected from the surface of the pile, it cannot represent the entire sample, since the large stones are located at the bottom, while the fines remain on the surface. In order to get a proper sample, it must be collected from different places.
Conclusion
The sieve analysis test might seem like a simple test, but it gives you precise information on how your aggregate will act in concrete, base, and drainage applications. Knowing how to read the curve makes it possible to identify any problems before they become costly on the job site.
If you need sand and gravel in Los Angeles that has been tested and sized to meet your needs, please contact Western Materials for assistance. Accurate estimates help determine sand and gravel quantities for large projects before ordering. Let us provide you with your test data, give us details on your project, and we'll make sure you pick the correct material.
Frequently Asked Questions
1. What is the purpose of a sieve analysis test?
A sieve analysis test provides the percentage of each particle size contained in sand or gravel. You can use it to know if the sand or gravel is suitable for concrete, road base, or drainage application. This way, you avoid making any mistakes when the materials are in your possession.
2. How long does a sieve analysis take?
The actual process of vibration takes around ten minutes, but there is more to it than just that. The drying, weighing, cleaning of the sieves, and calculation take some time. The process usually takes only a couple of hours to complete in most laboratories, but if the soil is very wet, it may take more. Moisture can affect sand quantity and material performance, particularly when estimating materials for a project.
3. What is the difference between coarse and fine aggregate sieves?
The coarse aggregate sieves will have bigger openings in inches, like 3/4” or 3/8”. The fine aggregate sieves will be numbered from No. 4 to No. 200 with very small openings. This helps to ensure that you get precise and meaningful results from the sieve analysis.
4. What does percent passing mean?
The percentage passing is the percentage of the sample by weight that can pass through a specific sieve size. For instance, if 70 percent pass through the No. 4 sieve size, 70 percent of the aggregate will be smaller than 4.75 millimeters.
5. Can I read a gradation curve without lab training?
Yes, the basics are actually quite easy. A gently sloping line indicates that the mixture is well-graded, whereas a steeply sloping line means that there are particles of about the same size. The line should be within the tolerance band specified for your particular construction.

Materials management and founders
have produced and supplied high quality
sand and gravel to contractors &
aggregate users across California.


